Performance Hot Spots
My code was running too slow. I tried changing some things. I short-circuited some loops. I manually garbage-collected some objects. I even changed some lists to tuples, because an old piece of Python folklore passed down through the ages says that “tuples are faster than lists”. But nothing worked.
It didn’t work because none of the changes were made at the hot spots. Hot spots are places in the code where an inordinate amount of execution time is spent. Code doesn’t always have hot spots, but they aren’t rare.
There are several methods for detecting hot spots in common use.
- Experience
- Instinct
- Guesswork
- Clairvoyance
- Hunches
- Superstition
- Gut
- Trial and error
- Measurement
Measurement is the only reliable method for finding hot spots. The other methods range from mostly ineffective to stupid and counterproductive. Working on performance without measuring is like cutting your own hair without a mirror. Believe me, I’ve done both.
I measured my code with a profiler, and here’s what I saw:
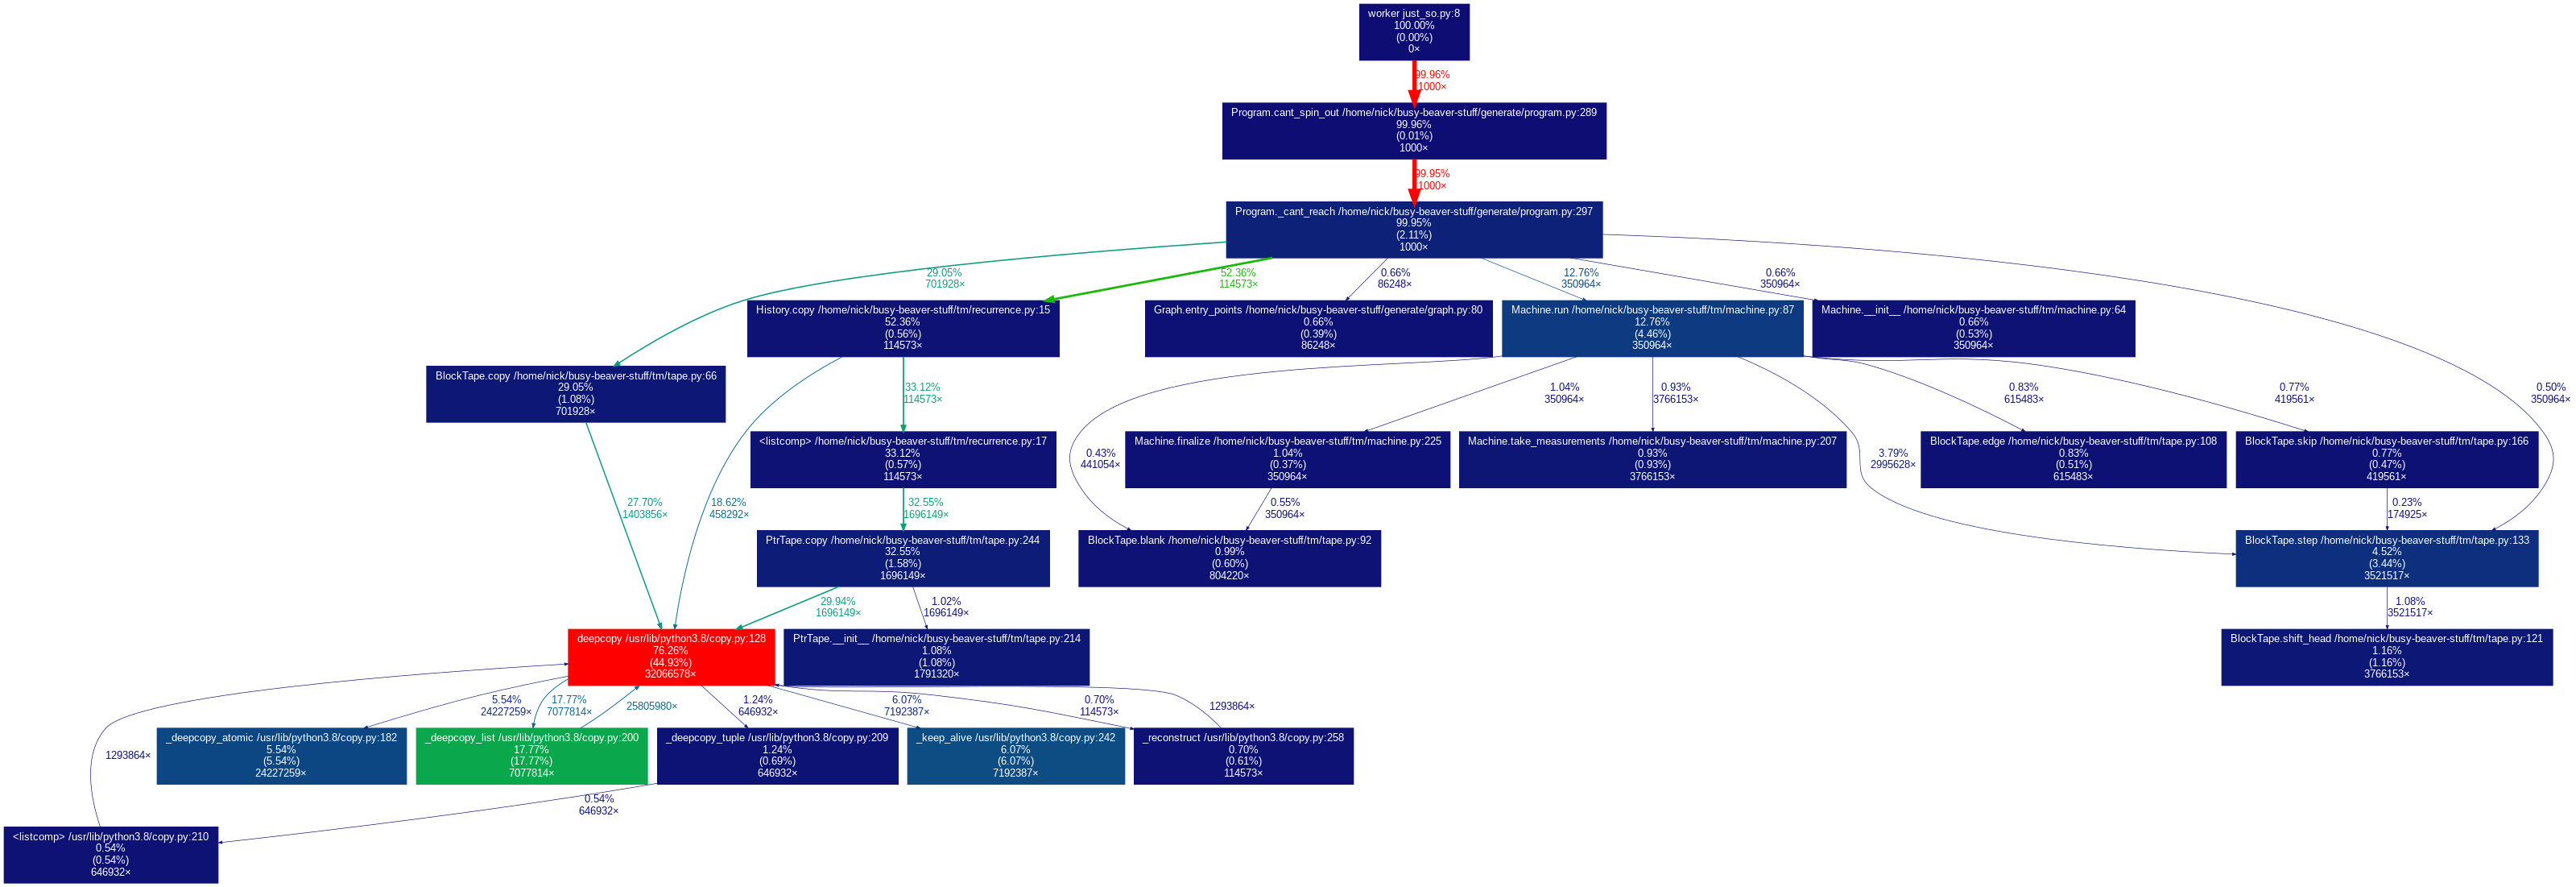
Can you guess where the problem is? That’s right, it’s the red box. According to the callgraph, a whopping 76% of execution time is getting spent in that box and its sub-boxes.
This isn’t an uncommon situation, and it isn’t always indicative of a problem. It could be that the red box is executing some critical computation, the hard core of what the app actually “does”, and the rest of the code is just dispatching fluff. In that case, it would seem that most of the work getting done is work that has to get done, and that’s good.
But that isn’t what’s going on in my code. Looking closer at that red box, I can see that it’s a Python library function, namely copy.deepcopy. 76% of execution time is spent deepcopying! Whoops! So much time is spent deepcopying that the profiler looked into that function’s innards; the green box is something called _deepcopy_list.
This is a performance bottleneck, and it’s a problem. It’s also an opportunity. It means that I can go in and change just a few lines of code and get a big performance improvement. And indeed that was accomplished in a single commit. It was just a matter of doing the copying a little smarter. No need to think about system design or algorithms or any other difficult stuff, which is great.
Here what the profiler showed afterwards:
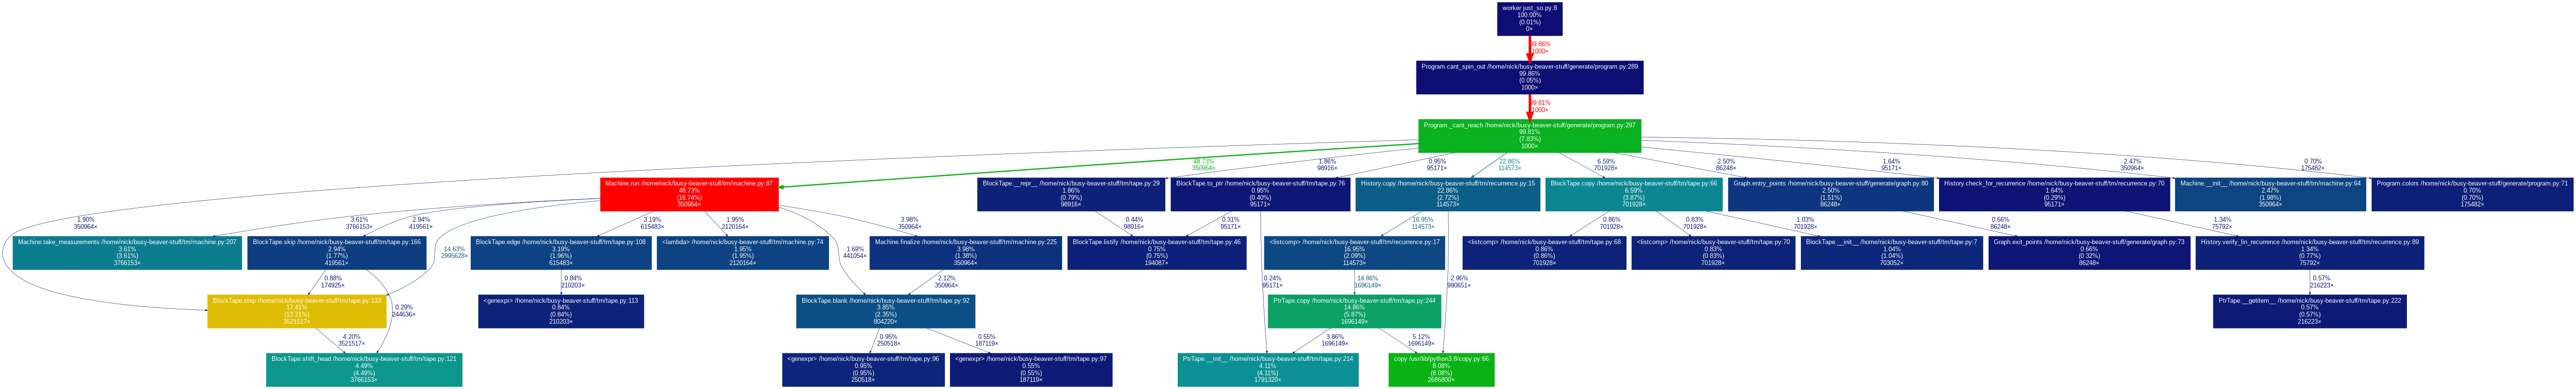
That is a healthier-looking callgraph. More green and yellow boxes indicate that the load is being spread around more. There’s still a red box, but instead of some crummy builtin, it’s a function called Machine.run. This is part of the core functionality, so the red box is not so concerning.
How to Create a Profiler Callgraph in Python
The general principles of profiling apply to any language, but the specific instructions vary. I’ll tell you how I do it in Python. I do it the same way every time and I don’t have a great insight into how the tools work. These are the incantations that have been passed down to me.
The profiling library is called yappi. It works by wrapping the main function, or the toplevel entrypoint or whatever:
import yappi

yappi.set_clock_type('cpu')
yappi.start()

try:
  main_or_toplevel_entrypoint_or_whatever()

finally:
  stats = yappi.get_func_stats()
  stats.save('yappi.callgrind', type = 'callgrind')
Run that, then convert the profiling data into Graphviz format with gprof2dot:
gprof2dot yappi.callgrind -f callgrind --colour-nodes-by-selftime | dot -T png -o yappi.png